HIDDEN Visualizing Change Over Time: How to Track Terrain and Volume Shifts in 3D with Voxel Space
August 6, 2025
HIDDEN Visualizing Change Over Time: How to Track Terrain and Volume Shifts in 3D with Voxel Space

-
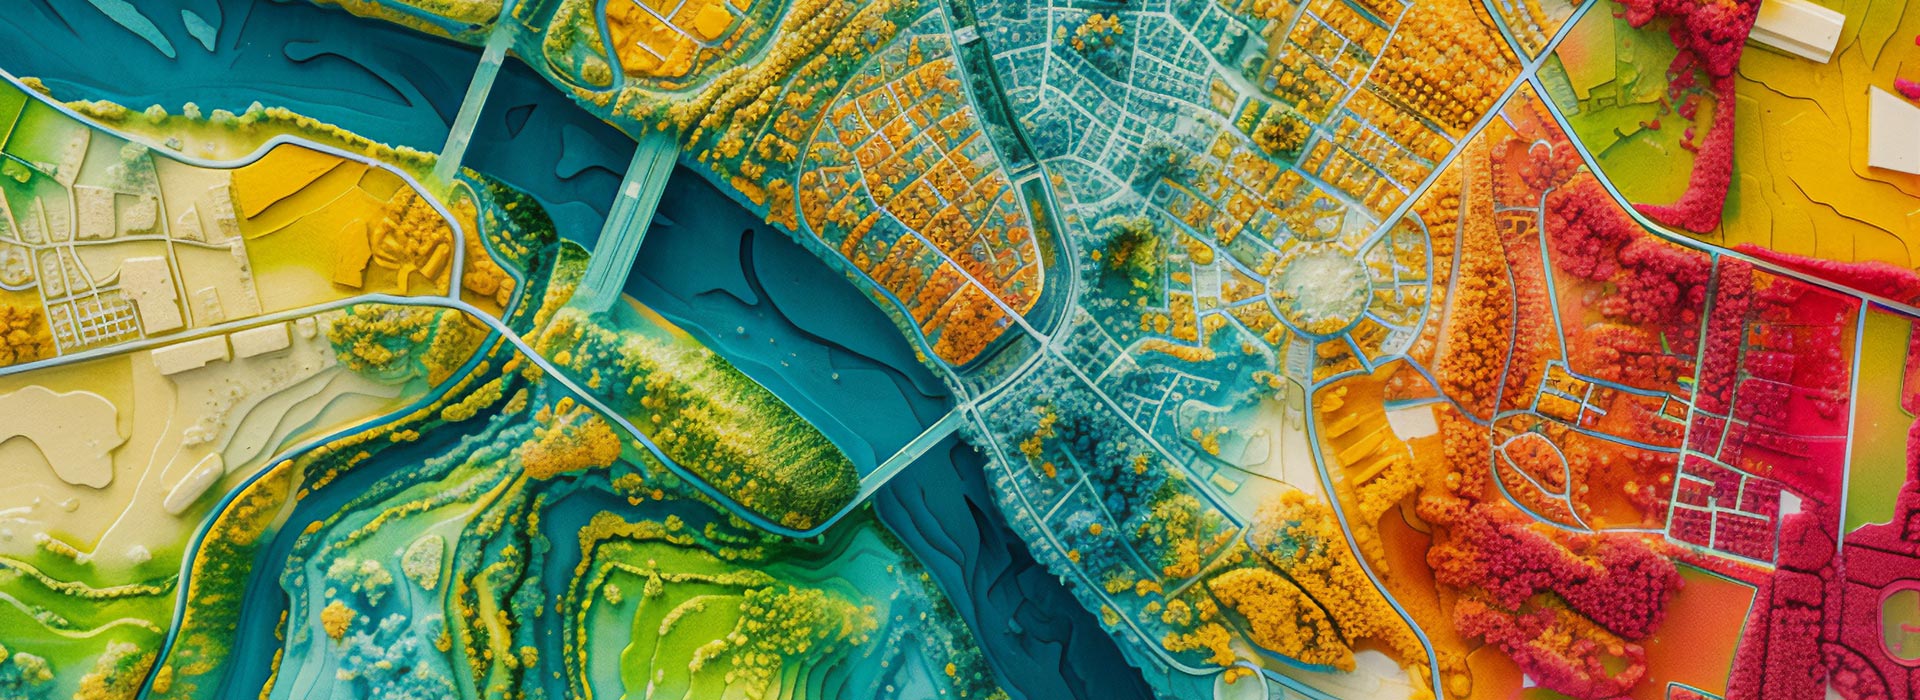
Getting Started with Voxel Space: Your First 3D Project
Voxel Space is designed to make complex spatial data intuitive, visual, and actionable.Whether you're working with point clouds,...
-
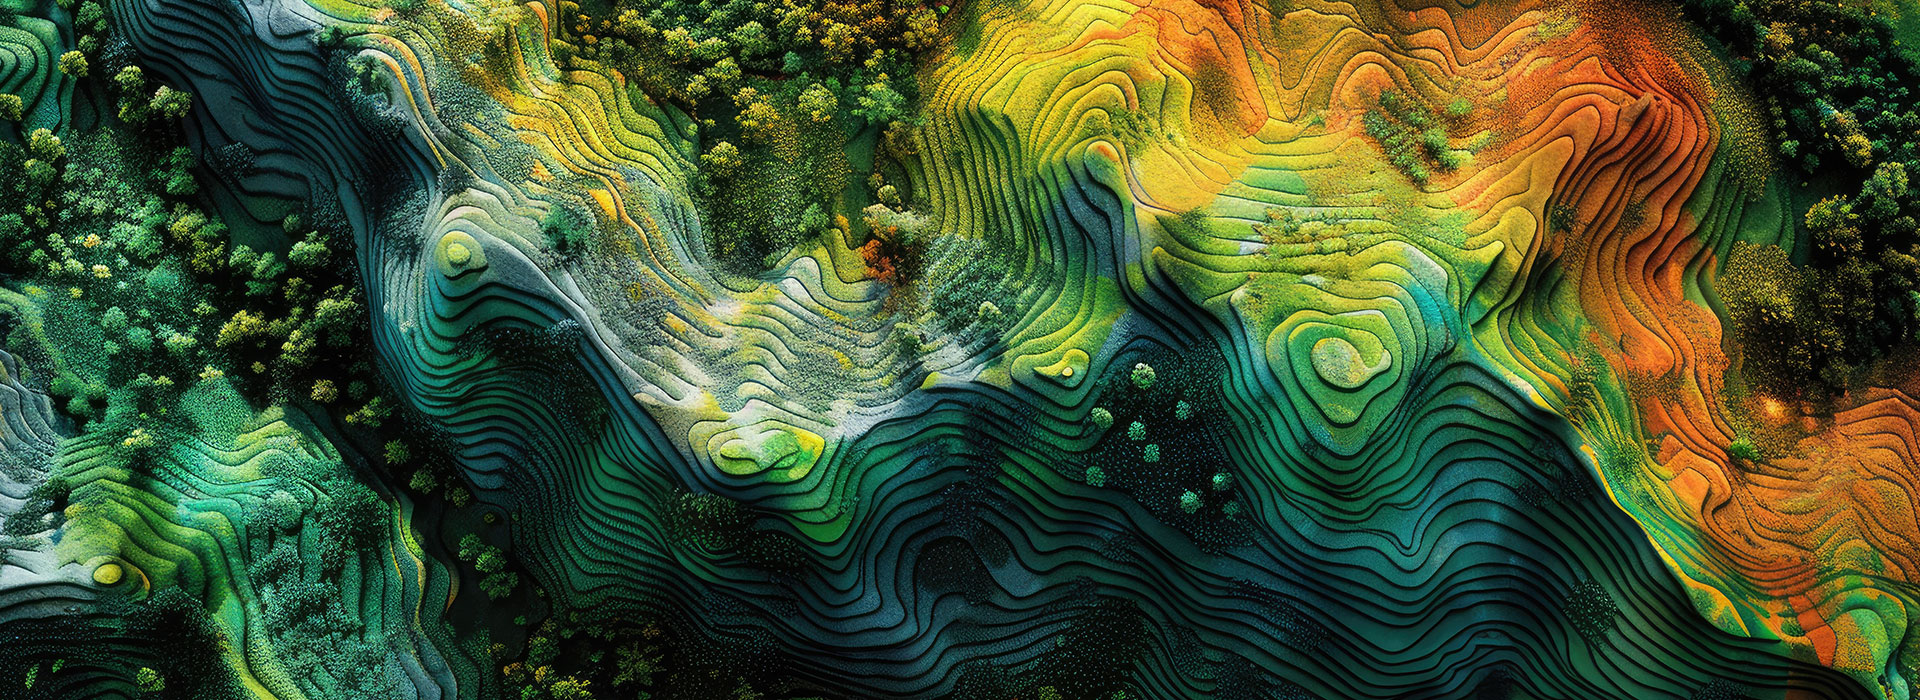
Tracking Change Over Time: Using Time-Aware 3D Models
In industries where landscapes, infrastructure, or operations evolve daily, seeing what has changed and when is critical.Whether it’s...
-
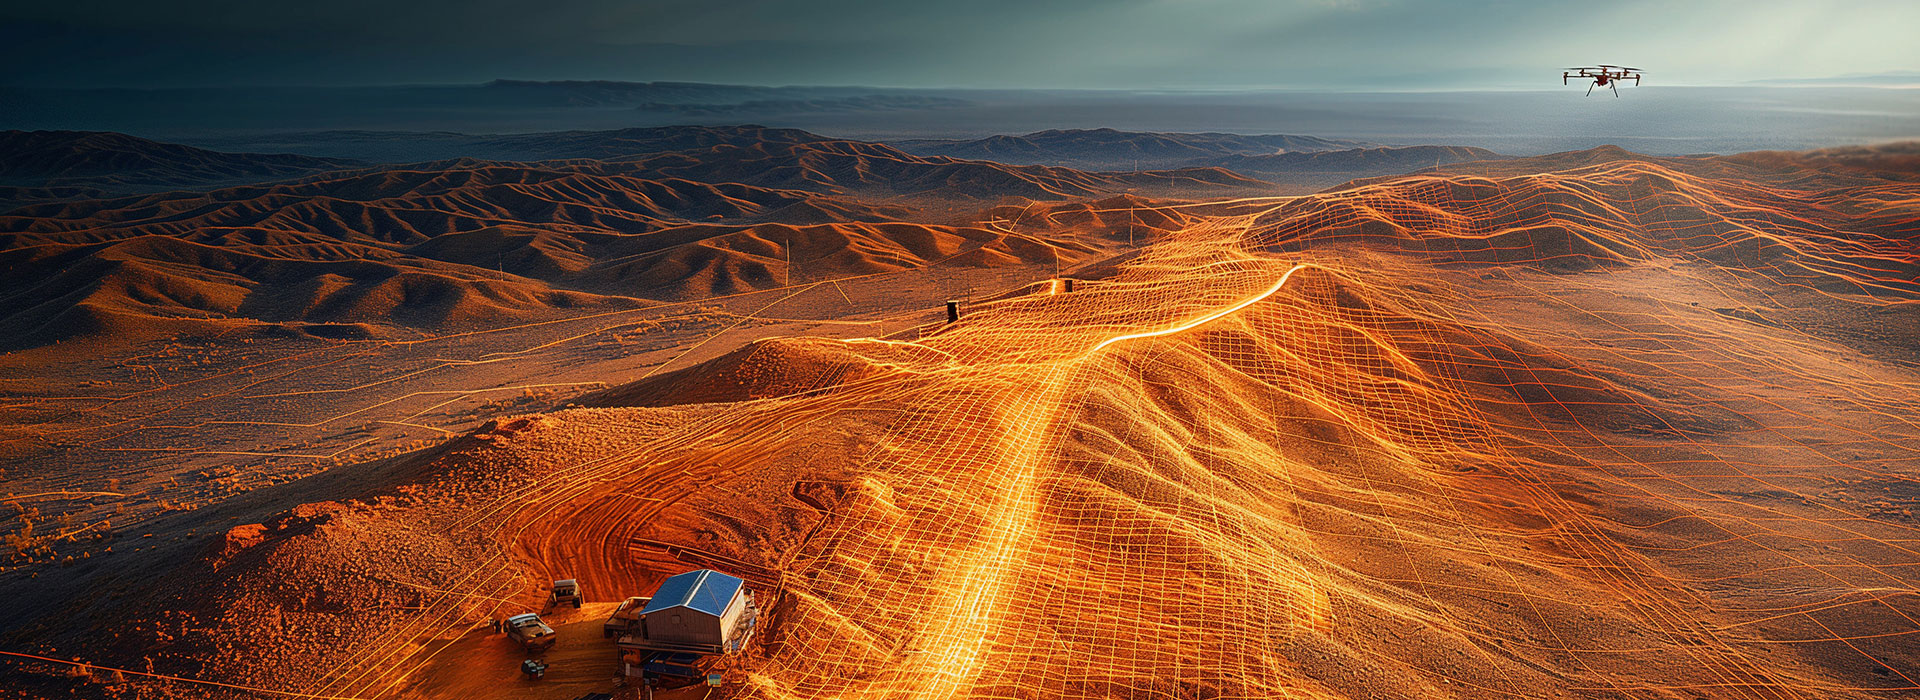
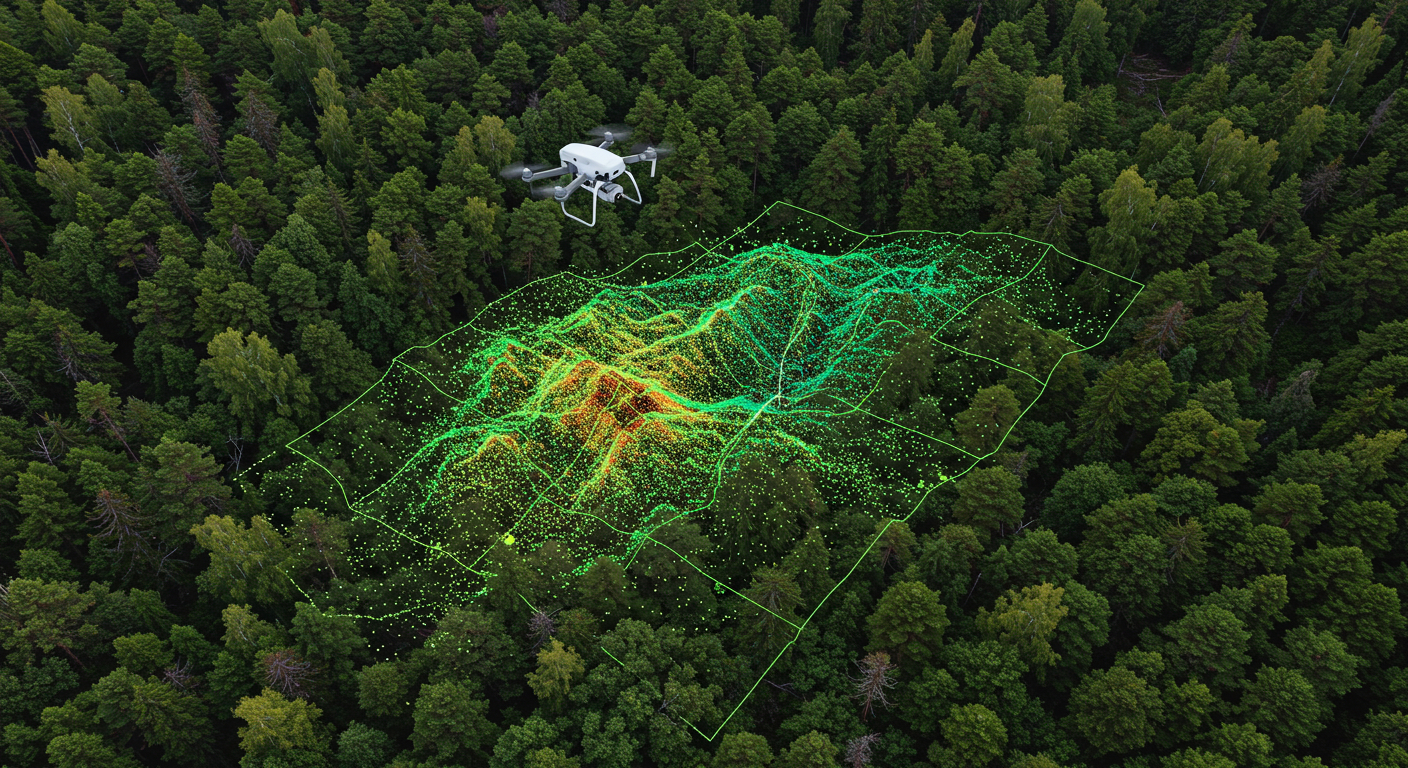
From LiDAR Scan to Volumetric Model in Minutes
LiDAR scanning has become a game-changer for capturing real-world environments in incredible detail.But for many professionals, the challenge...